Now you can import Xray’s data into eazyBI!
We believe that we are great by being greater together. Thus, we provide and foster integrations with popular and powerful add-ons, such as Structure, and now also with the famous eazyBI add-on.
eazyBI is a powerful add-on for JIRA Server and JIRA Cloud, providing easy-to-use drag-and-drop creation of custom reports, charts, and dashboard gadgets. Import your data from JIRA Software, JIRA Service Desk, Tempo Timesheets, Xray and other popular add-ons. Visualize and analyze all your data using many chart types.
Independently and in parallel to the upcoming native reporting features coming ahead, namely in the v2.1 release, we worked together with eazyBI to provide both of our customers great reporting capabilities now and in the future.
Starting with eazyBI version 4.2, you can import and analyze data from Xray for JIRA in many different ways, thanks to the flexibility and powerfulness of eazyBI.
How it works
To take advantage of eazyBI features, you don’t need to do anything in Xray. The integration is done at eazyBI’s side, by processing Xray’s internal data; you just need to use an updated version of eazyBI.
Importing Xray’s Data
eazyBI will automatically detect if you have Xray for JIRA (server) installed and give you an additional option in eazyBI’s JIRA Import settings. By checking it, a few dozen new Xray dimensions and measures will be imported.
You’re also able to import custom fields, such as Test Environments, but first you have to configure the custom field mappings as mentioned in eazyBI’s documentation. In order to obtain the custom fields ID’s, you have to go to “JIRA’s administration > Issues > Custom fields”.
Examples of reports
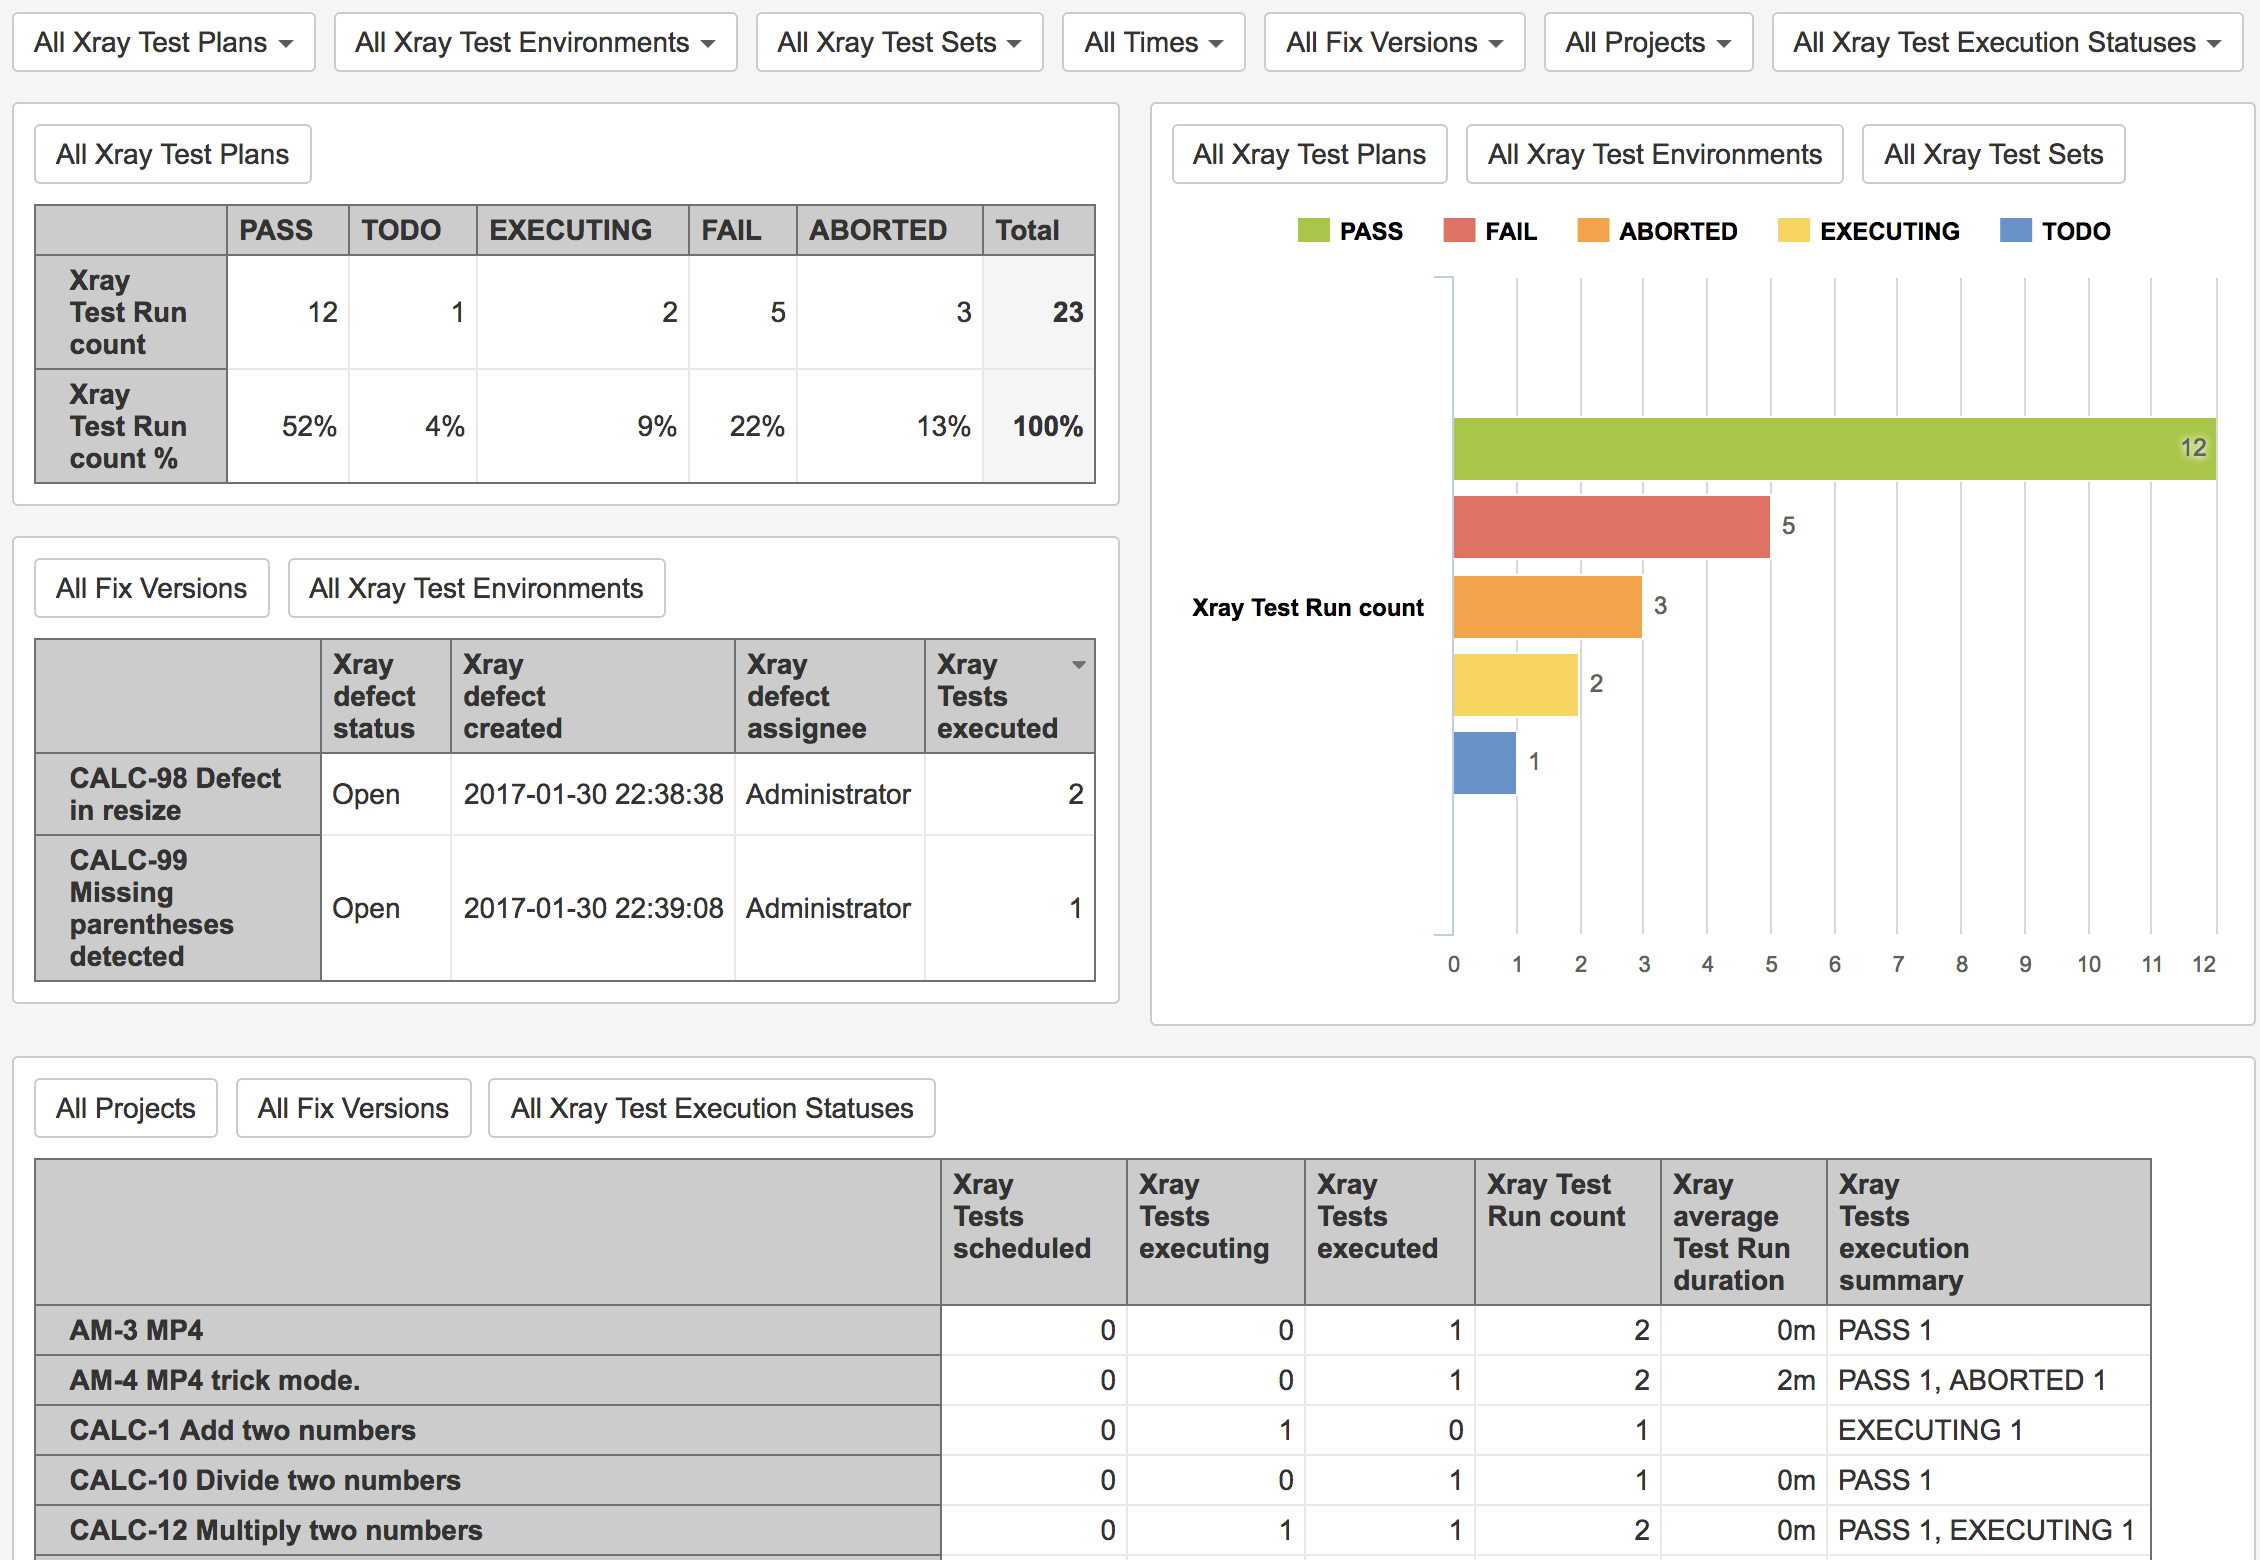
With eazyBI you can make tabular or graphical reports, by configuring the rows, the columns and the measures you want to make out of your “cube”.
Some reports may be quite straightforward, while other may require some “configuration”, namely if you want to make some new, non-existent measure(s).
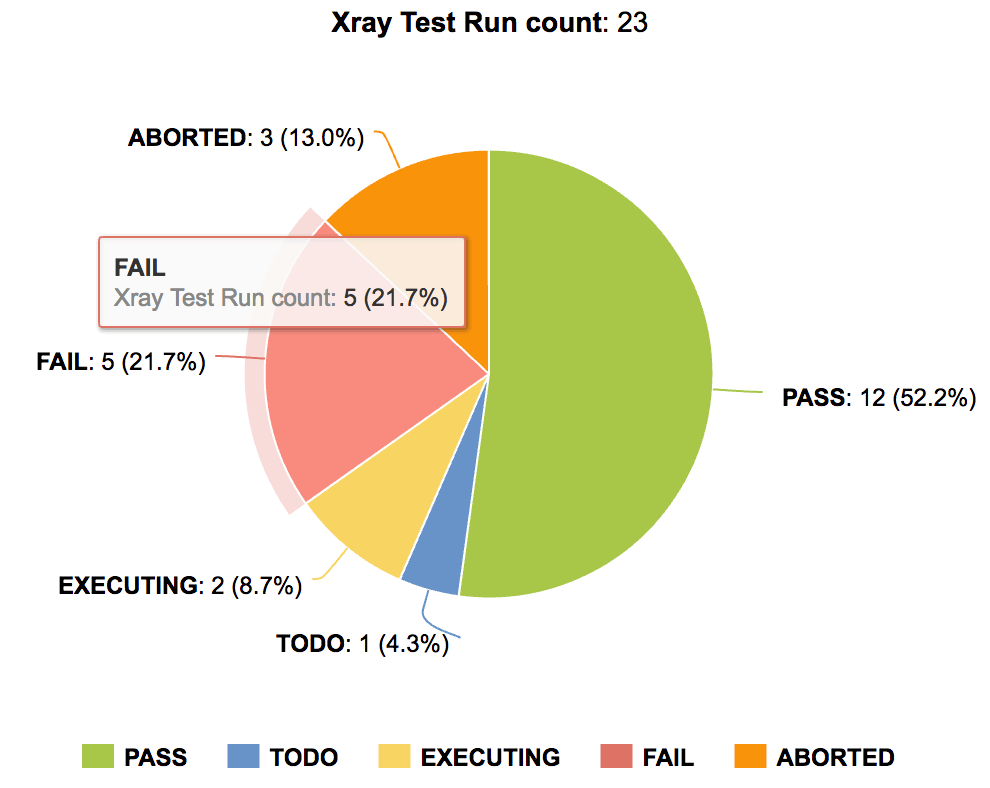
Overall Xray Test Run Results
You can create a simple Test Run report with filters where you can specify Test Plan, Test Environment, or a time period.
Top Defects Report
You may create a report for listing the defects that are impacting most in the tests being executed.
This is somehow like user story XRAY-1197, currently in our backlog.
Report Dashboards
eazyBI supports dashboard creation, that you can use in order to combine several Xray related reports in one dashboard.
You can also use eazyBI’s reports and dashboards in JIRA dashboards, by using proper gadgets.
Learn more
There are so many reports you can achieve by using eazyBI, so we’ve just touched the surface here.
We will promote a joint webinar in the near future, so you can see how this works in practice and have the opportunity to clarify some questions.
Meanwhile, we suggest you to take a look at eazyBI’s documentation and articles related to this topic.
- eazyBI’s specific documentation for Xray
- eazyBI blog post detailing integration with Xray, including usage examples
- Xray’s documentation page summarily describing integration with eazyBI


